
HL-DP
(Data Platform)
This data platform collects, and stores data acquired by our 3D LiDAR to the cloud for various applications.
Furthermore, devices at multiple locations can be centrally managed and maintained.
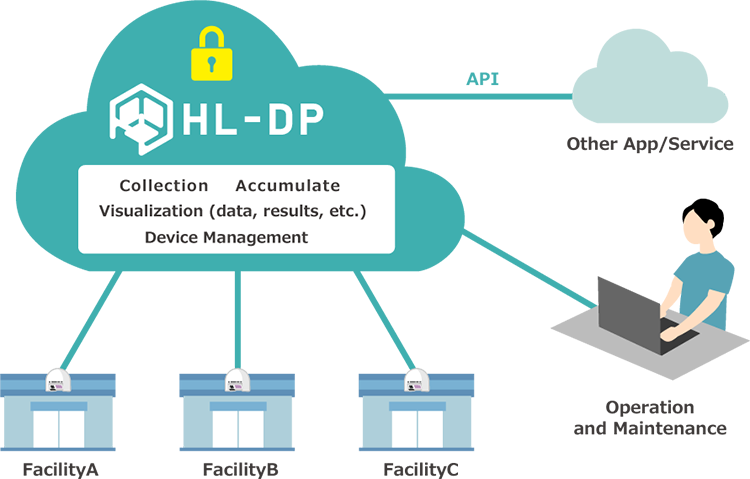
Features of HL-DP

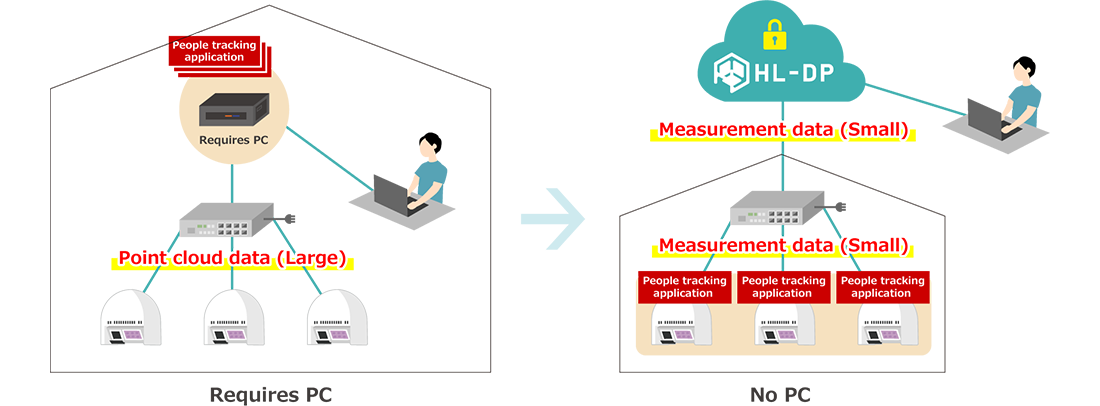
No control PC required
The CPU in the sensor performs the flow line measurement and sends only the measurement results directly to the cloud, eliminating the need for a PC or server for control at the site.

Remote Management
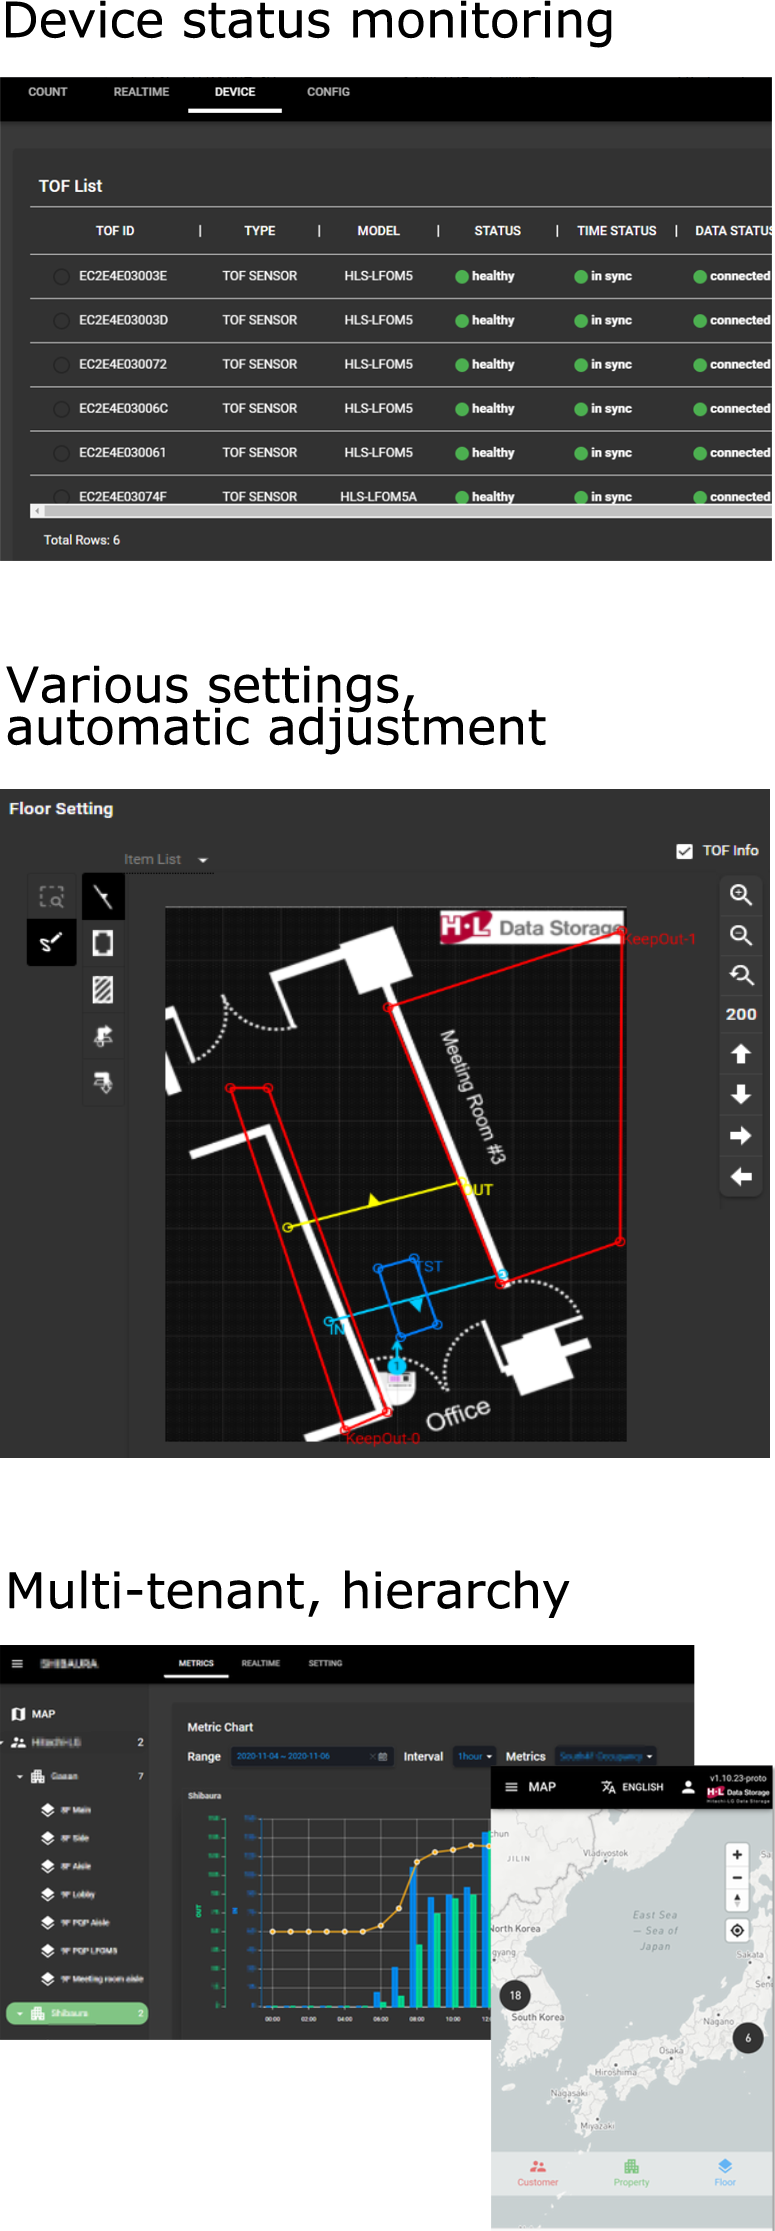
The acquired data can be viewed anytime, anywhere from a PC or smartphone, and various settings, adjustments, and sensor status monitoring can also be performed remotely.

Easy measurement setup
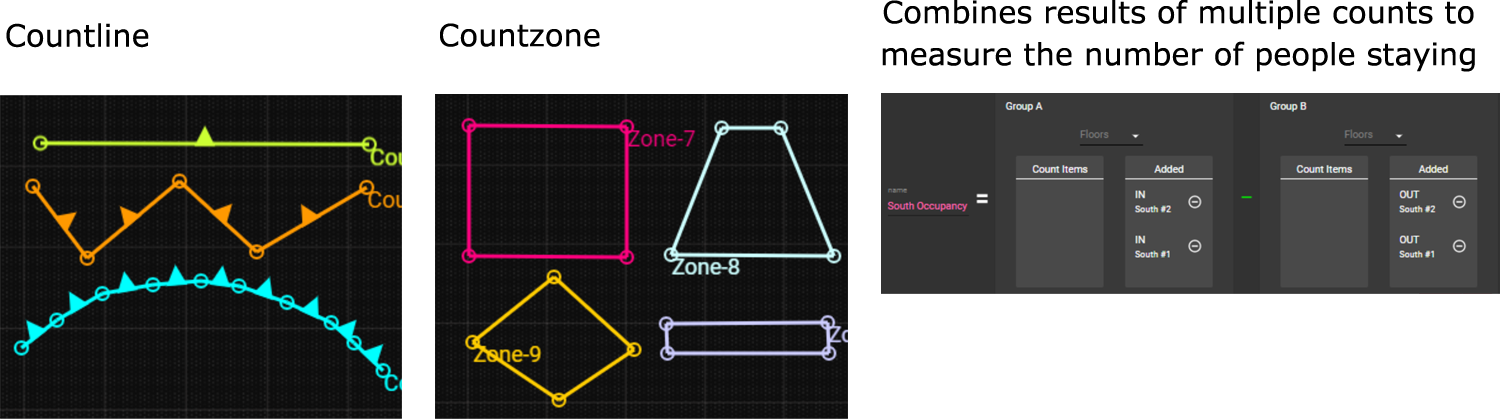
Lines for measuring the number of people and zones for measuring time spent can be set freely and easily with the mouse.

visualization (data, results, etc.)
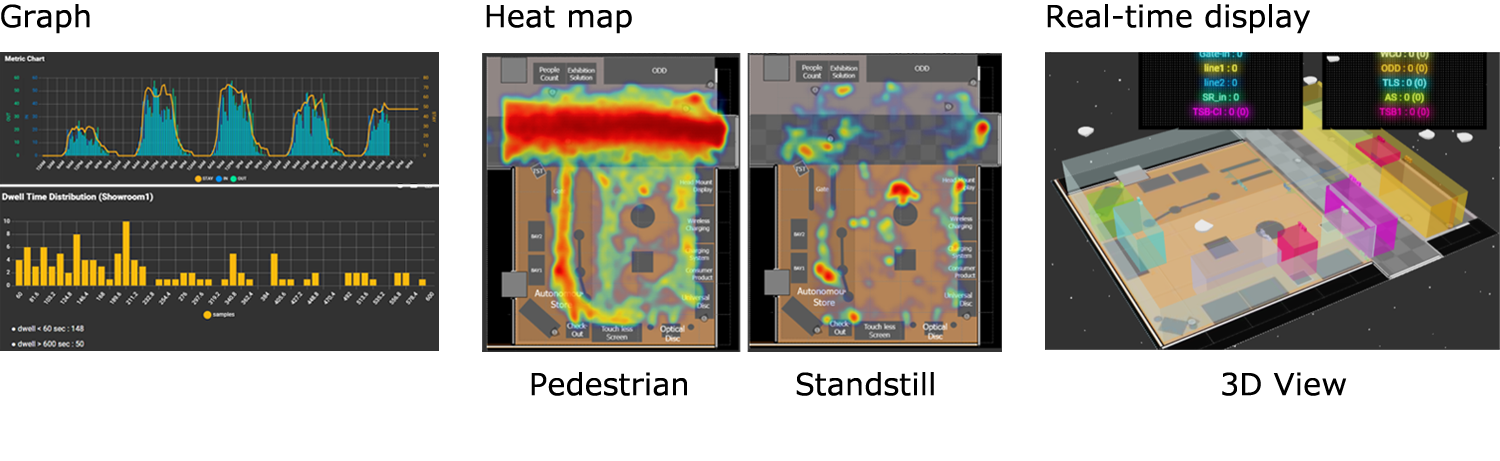
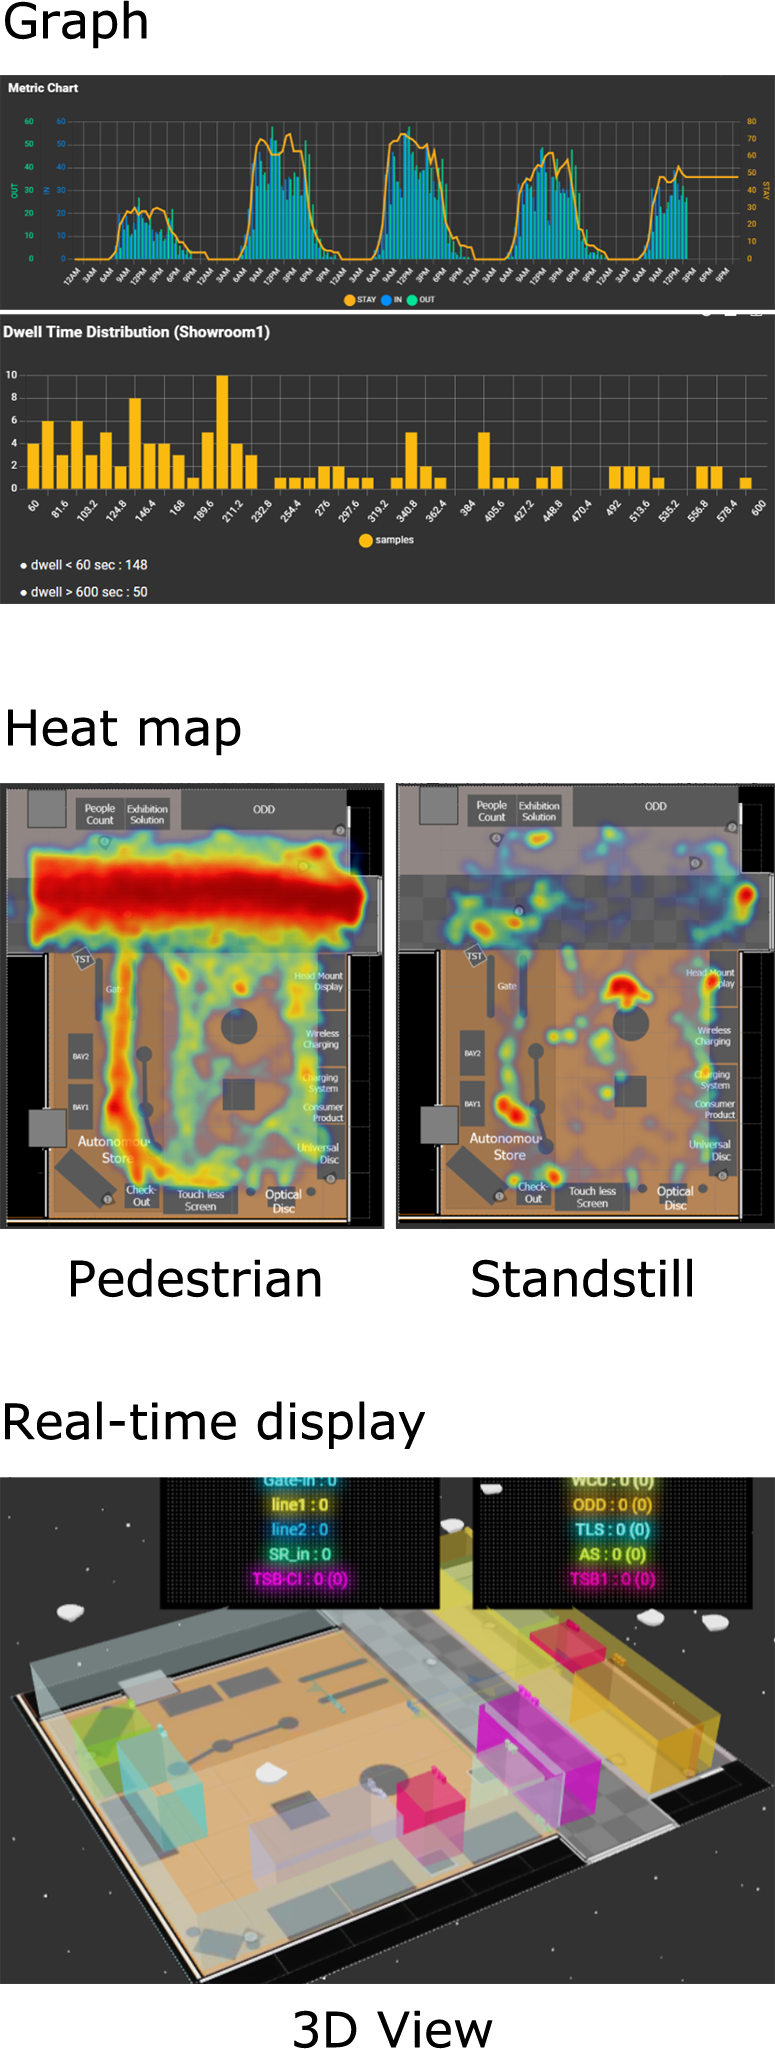
Gadgets that visualize data in various ways are available to help you analyze the data.

API
Stored data can be retrieved externally via Web API, enabling linkage with various applications.
No control PC required
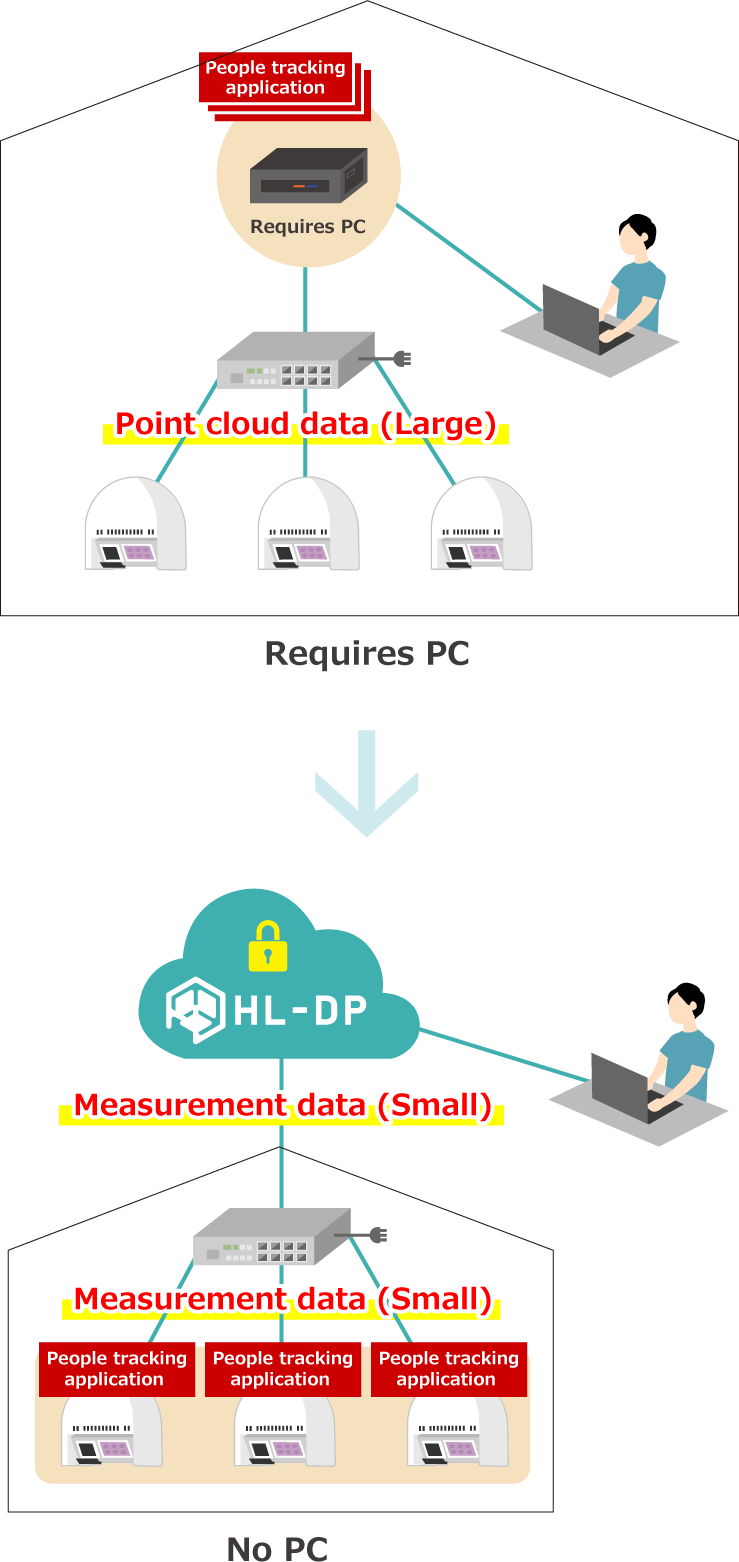
The CPU in the sensor performs flow line measurement and sends only the measurement results directly to the cloud, eliminating the need for a control PC or server at the site.
- No need to prepare PCs or install SDKs and applications.
- This saves space for PCs at each location and eliminates on-site maintenance due to physical problems with the PCs.
- Since flow line measurement is performed within the sensor, distributed processing is possible even if the number of sensors increases, and traffic on the network does not increase significantly in proportion to the number of sensors.
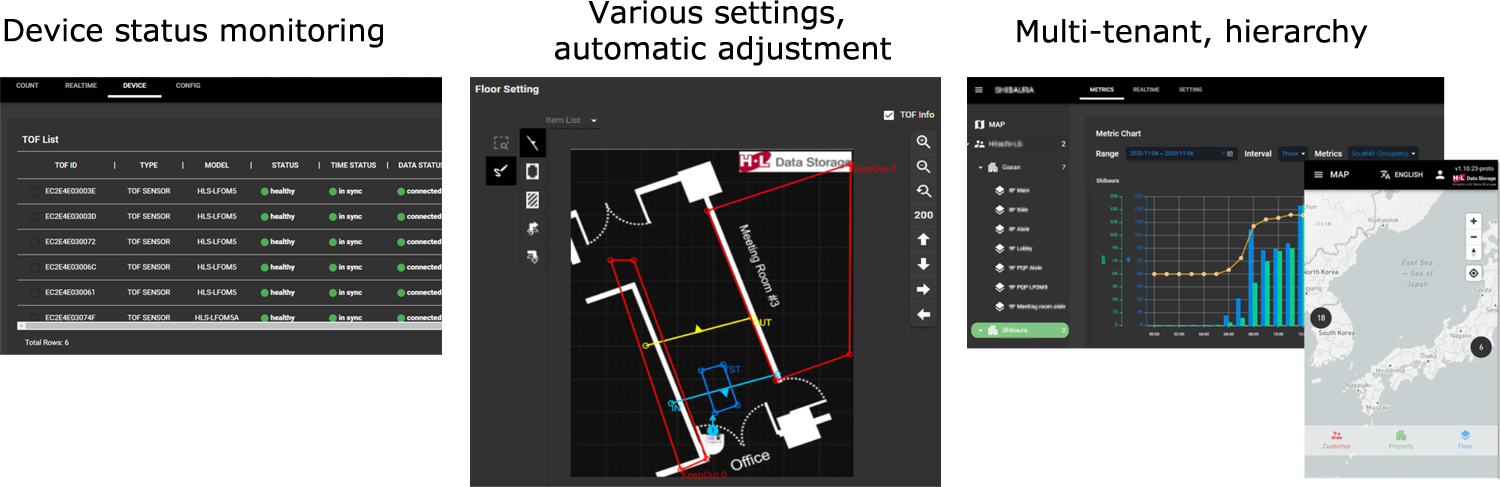
Remote Management
- LwM2M protocol allows for device monitoring, remote control, firmware updates, etc.
- Remote viewing of various data, various settings, and automatic measurement of sensor angles are possible.
- Multi-tenancy allows hierarchical management of multiple customers and locations.
Easy measurement setup
Lines to measure the number of people and zones to measure time spent can be drawn freely and easily with the mouse.
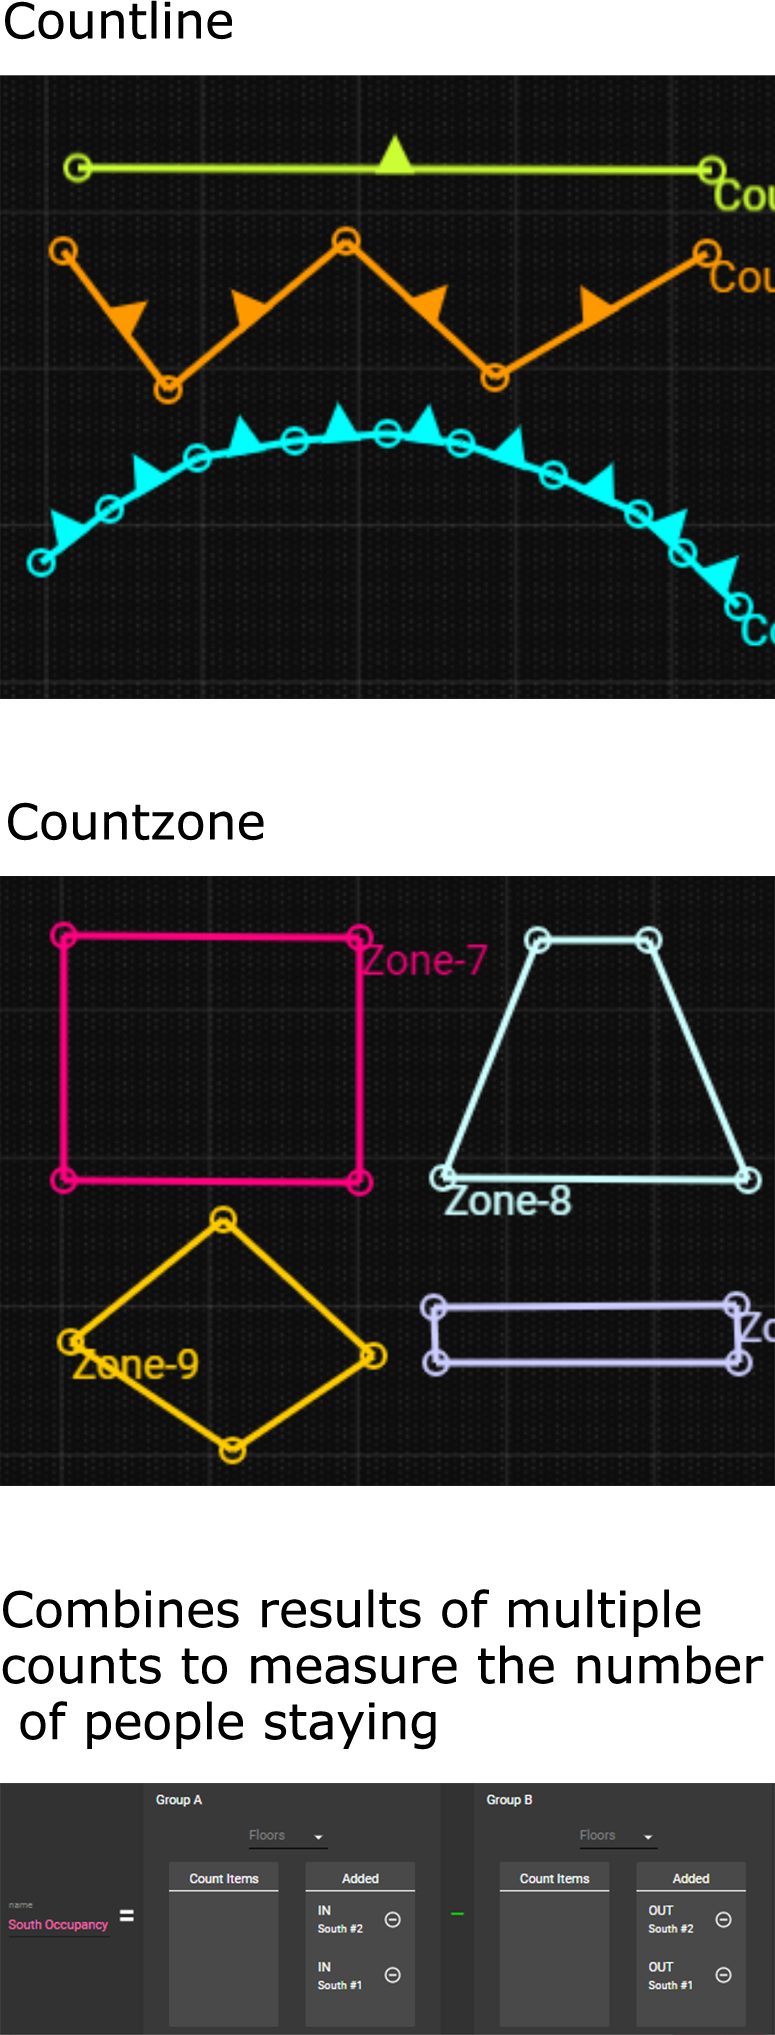
- Contlines are counted only when they cross in one direction, and not count when they cross back and forth on the line.
- Countzones can measure the number of people staying in a zone and the distribution of the time spent in the zone.
- The number of people entering and exiting the building measured by sensors installed at multiple entrances and exits can be combined to measure the current number of people staying in the entire building.
Visualization (data, results, etc.)
Gadgets that visualize data in various ways are available to help you analyze the data.
- Graphs can be generated for both past and current data.
- Generate various types of heat maps for a specified time period.
- Real-time 2D and 3D displays of local traffic flow conditions.
API(Application Programming Interface)
Stored data can be retrieved externally via Web API, enabling linkage with a variety of applications.
- Web API (REST API) is provided, allowing easy development of external applications that utilize the data in HL-DP.
- Accumulated traffic data can be saved as JSON files.
- The motion data is stored in frames (100 milliseconds) for each person, including time, unique ID, coordinates, height, and other information.